Urolithin A particle size can affect weighing, blending, transfer and filling even when a powder meets its assay specification.
This physical attribute is therefore a practical quality measure, not a decorative line on a technical data sheet. Particle-size distribution, shape, agglomeration, moisture and density interact with the buyer’s equipment and process. A useful specification states how the attribute is measured, how the sample is prepared and which part of the distribution matters to the intended operation.
This guide is for ingredient buyers, formulation scientists, process engineers, QA teams and contract manufacturers. It explains how to request particle-size data, compare methods, design representative sampling, interpret common powder-property results and turn a laboratory measurement into a controlled incoming specification. It does not prescribe one universal particle-size range for every product or process.
Working rule: a particle-size number has meaning only when the sample, dispersion method, measurement basis and application decision are recorded with it.
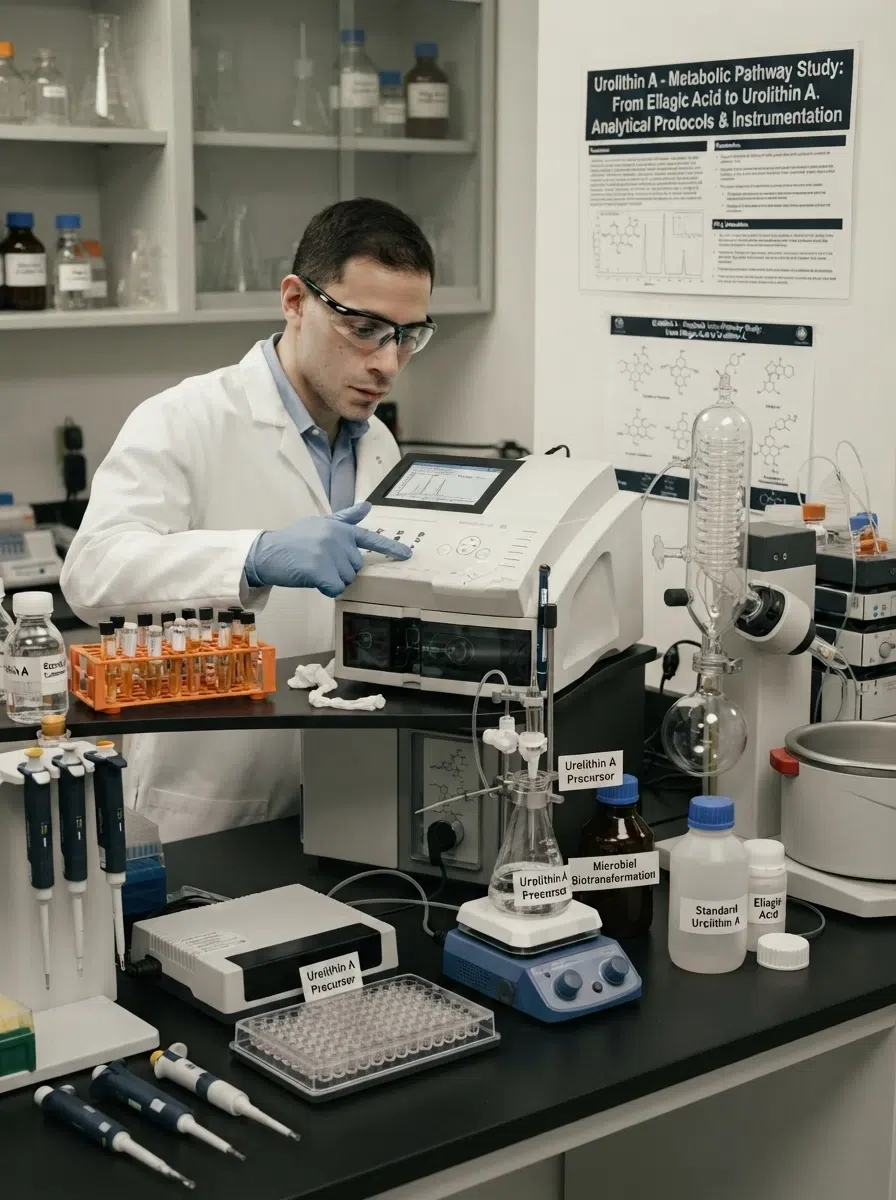
What Urolithin A particle size tells a buyer
In practice, particle size describes the dimensions of individual particles or agglomerates under a defined measurement model. A report may present a median value such as D50, percentile values such as D10 and D90, a span, a sieve fraction or a microscope-based description. Those outputs are not interchangeable.
For example, particle size can influence powder flow, segregation, dust formation, wetting, dispersion, blend uniformity, compaction and the time required to transfer material through equipment. The direction and magnitude of the effect depend on particle shape, surface texture, electrostatic behaviour, moisture and the other ingredients in the process.
Property-to-decision map
| Buyer question | Useful powder evidence | What it cannot establish alone |
|---|---|---|
| Will the powder pass through a feeder? | Particle-size distribution, flow test and bulk density | Performance on a specific machine without a process trial |
| Will a blend remain uniform? | Distribution, shape, density and segregation observations | Finished blend uniformity without matrix testing |
| Will it disperse in a liquid? | Size, wetting observations and agglomerate information | Complete dispersion behaviour in every formula |
| Is a lot consistent? | Defined sampling plan and comparable PSD results | Uniformity of an entire shipment from one small test portion |
| Did a process change matter? | Pre/post PSD, moisture, density and morphology comparison | Proof of unchanged assay or impurity profile without chemical tests |
Start with the Urolithin A specification framework, then add only the physical attributes that support a defined buyer decision. More numbers do not automatically create a better specification.
Define the Urolithin A particle size limit for the application
Therefore, a limit should answer a process problem. A powder transferred by gravity may need different control from a powder fed by a screw, compacted into a tablet, blended with a low-dose carrier or dispersed into a beverage premix. The same D50 can be useful in one operation and irrelevant in another.
Before requesting a supplier range, write the application, equipment and failure mode. This prevents a common mistake: selecting a round-number mesh or micron limit because it appears familiar rather than because it controls the operation.
Application brief for powder properties
- Material form, grade and expected lot size.
- Operation in scope: weighing, conveying, blending, filling, compaction or dispersion.
- Equipment type, feed rate and any narrow openings or screens.
- Co-ingredients, carrier ratio and expected blend time.
- Moisture and temperature conditions during handling.
- Particle-size output needed: sieve fraction, D-values, span or another metric.
- Action when a result is outside the target range.
Once the process is defined, the supplier can recommend a measurement approach that relates to the actual operation rather than reporting an isolated laboratory statistic.
Read Urolithin A particle size distribution instead of one average
First, a distribution shows how particle sizes are spread across a sample. D10 is the size below which 10% of the measured volume or mass lies, D50 is the median under the stated basis, and D90 is the size below which 90% lies. Always record whether the distribution is volume-, mass- or number-based.
By contrast, a narrow distribution and a broad distribution can share the same D50. The broad distribution may contain more fines or coarse agglomerates that affect flow and segregation. For that reason, a buyer often needs at least D10, D50 and D90, together with a defined span or a critical oversize/fines limit.
PSD fields to request
| Field | What to confirm | Why it matters |
|---|---|---|
| D10 | Basis, unit and calculation method | Shows the lower tail and potential fine fraction |
| D50 | Median basis and measurement model | Useful centre point, but not a complete distribution |
| D90 | Upper-tail basis and agglomerate handling | Highlights coarse material or incomplete deagglomeration |
| Span | Formula and percentile inputs | Provides a simple spread indicator when used consistently |
| Tail fractions | Fines and oversize definition | May relate more directly to screens, dust or segregation |
| Report basis | Volume, mass, number or sieve mass | Different bases cannot be compared as if identical |
Ask the supplier for a distribution plot or cumulative table when the tail fractions matter. A single D50 in a quotation rarely shows whether the lot contains a long fine or coarse tail.
Choose a Urolithin A particle size testing method
In practice, sieve analysis separates material through a stack of apertures and reports the mass retained or passing each sieve. It is transparent and useful for coarser powders or defined oversize checks. It may be less informative when most particles are below the practical sieve range or when fragile agglomerates break during shaking.
By comparison, laser diffraction estimates a distribution from the way particles scatter light. It can cover a broad size range quickly, but the result depends on dispersion energy, optical assumptions, concentration, refractive-index inputs and whether agglomerates are intentionally broken apart.
Method comparison
| Method | Strength | Key control point | Typical limitation |
|---|---|---|---|
| Sieving | Direct mass fraction by aperture | Sieve condition, shaking energy and sample loading | Limited resolution for very fine or cohesive material |
| Laser diffraction | Fast distribution over a broad range | Dispersion, optical model and concentration | Different settings can produce different distributions |
| Microscopy | Visual shape and agglomerate evidence | Representative field selection and image analysis | Small field may not represent the lot |
| Image analysis | Particle shape and projected dimensions | Segmentation, magnification and thresholding | Two-dimensional projection is not every particle dimension |
The ISO 13320 particle-size analysis standard provides a recognized framework for laser-diffraction measurements. Use the method version and laboratory procedure that apply to the buyer’s quality system; do not assume two instruments are equivalent because both are labelled laser diffraction.
Control sampling before measuring Urolithin A particle size
Because particle size is sensitive to where and how a sample is taken, sampling conditions must be controlled. A fine fraction may settle, a coarse fraction may remain near the top, and agglomerates may form near a liner or container wall. A small scoop from one location may therefore describe the sampling action more than the shipment.
Therefore, define the number of containers, sampling locations, amount taken, mixing instruction and composite rule. If the buyer needs container-level information, do not combine all portions into one composite and lose the location data.
Sampling record
- Identify the product, lot, container count and storage condition.
- Record which containers and locations were sampled.
- Use clean, dry tools and a written sample-handling instruction.
- State whether portions were tested separately or composited.
- Seal and label retained portions with lot and sampling references.
- Record time between sampling, conditioning and measurement.
A supplier’s “typical particle size” is useful for early screening, but it is not a lot-specific release result unless the sampling and test record identify the lot.
Separate primary particles from agglomerates
In practice, powders can contain individual particles, soft agglomerates and hard agglomerates. A measurement may report the primary particles if the dispersion step breaks soft clusters, or it may report the clusters if the method preserves them. Both outputs can be valid when the question is clear.
Then ask the laboratory to state the dispersion energy, wetting agent, sonication, stirring and endpoint. Excessive energy can create an artificially fine result by breaking material that remains intact in the buyer’s process. Insufficient energy can exaggerate the coarse tail.
Agglomeration review questions
- Does the method measure the powder as received or after deliberate deagglomeration?
- Is the dispersion medium compatible with the material and detector?
- How was the endpoint selected and recorded?
- Were wet and dry measurements compared when moisture may change cohesion?
- Does microscopy support the interpretation of the coarse fraction?
- Can the laboratory repeat the result after a defined conditioning step?
For a process that intentionally screens or deagglomerates the powder, specify the pre-process and post-process measurements separately. Combining them creates an ambiguous acceptance limit.
Review moisture and conditioning with particle size
In addition, moisture can change cohesion, electrostatic charge, density and agglomeration. A particle-size result measured at one humidity may not represent the powder after a long shipment or a different warehouse condition. Record the conditioning time, temperature and relative humidity when those variables are relevant.
However, do not interpret a moisture result as a particle-size result. Use moisture or loss-on-drying data to explain a shift, then confirm the physical behaviour with a defined particle and flow test.
Conditioning fields
| Field | Review question | Possible influence |
|---|---|---|
| Sample moisture | Was it measured on the same portion or a linked portion? | Cohesion and density may shift with moisture |
| Conditioning time | How long was the sample equilibrated? | Short conditioning can increase result variability |
| Humidity | Was relative humidity controlled or recorded? | Electrostatic and agglomeration behaviour may change |
| Temperature | Was the sample warm from transport or equipment? | Moisture exchange and flow can be affected |
| Container opening | How long was the pack exposed? | Open time can change the portion before testing |
When a lot is close to a particle or flow limit, align the conditioning instruction between supplier and buyer before comparing results.
Measure bulk and tapped density as related attributes
First, bulk density is the mass per occupied volume before a defined compaction step. Tapped density is measured after a specified tapping procedure. Their difference can indicate how much a powder settles, but neither value alone describes all flow behaviour.
In addition, report the cylinder or vessel, fill method, sample mass, tapping count or endpoint and calculation basis. A funnel-filled value and a scooped value may differ even when the powder is unchanged.
Density-report checklist
| Item | What to record | Why it matters |
|---|---|---|
| Bulk density | Fill method, volume, mass and conditioning | Reflects the packing state created by the procedure |
| Tapped density | Tap count, endpoint and vessel dimensions | Shows response to a defined compaction input |
| Hausner ratio | Formula and source values | Useful comparison index only when methods match |
| Carr index | Formula and rounding convention | Can summarise compressibility but not machine performance |
| Replicates | Independent preparations and variation | Shows whether the powder and test are consistent |
Use the quality documentation framework to request a controlled density procedure rather than accepting an unexplained single value in a supplier brochure.
Evaluate flowability with a defined test, not a visual label
However, terms such as “free-flowing” or “easy to handle” are not controlled test results. Flow depends on particle size, shape, surface roughness, moisture, electrostatics, consolidation history and equipment geometry. A useful evaluation states the test apparatus, conditioning and result.
For example, possible tests include angle of repose, shear-cell measurements, flow through an orifice, compressibility and dynamic powder rheology. Choose the method that relates to the operation. A shear result can support hopper design, while a small-orifice flow test may be more relevant to a dosing step.
Flowability review
- Define the operation and failure mode before selecting the test.
- Record conditioning, consolidation stress and sample preparation.
- Use replicate measurements and report variation.
- Compare lots using the same apparatus, settings and calculation.
- Confirm the laboratory result with a small process trial when equipment response matters.
A flow result should support a decision such as screen selection, feeder setup or blend handling. It should not be presented as a universal grade of the material.
Consider particle shape and surface morphology
By contrast, two powders with similar size distributions can behave differently if one is angular, plate-like, porous, rough or highly irregular. Shape affects contact points, packing, drag, flow and wetting. Microscopy or image analysis can add context when a process problem cannot be explained by D-values alone.
In addition, ask whether the images are representative, how many particles were measured and how touching particles were separated in the analysis. A small selection of attractive images is not a morphology specification.
Morphology fields
| Field | Evidence | Interpretation boundary |
|---|---|---|
| Shape description | Defined terms and representative images | Qualitative unless linked to image metrics |
| Aspect ratio | Calculation and particle count | Depends on two-dimensional projection |
| Surface texture | Microscopy or appropriate imaging | Resolution and preparation affect visibility |
| Agglomerate count | Size threshold and counting rule | Method must state whether clusters were broken |
| Porosity | Defined technique and sample condition | Not inferred from appearance alone |
Use morphology data to investigate a defined handling or dispersion question. Avoid adding shape metrics to a routine specification if the buyer has no decision linked to them.
Build a lot-comparison plan for powder properties
First, lot comparison requires a stable method and a representative design. Compare at least the same particle-size outputs, sample preparation, conditioning, instrument settings and calculation basis. If the supplier changed milling, drying, packaging or storage, include the attribute most likely to respond to that change.
In practice, trend data are often more informative than one pass/fail result. A gradual shift in D90, moisture or tapped density may signal a process drift before a formal limit is crossed.
Lot-trend fields
| Trend | Record | Review question |
|---|---|---|
| Particle distribution | D10, D50, D90 and spread | Is the tail moving while the median appears stable? |
| Moisture | Result, method and sample condition | Does moisture explain a shift in cohesion? |
| Density | Bulk, tapped and calculation basis | Is packing behaviour changing with the lot? |
| Flow | Defined test, replicate values and condition | Does the change match an observed handling issue? |
| Process context | Drying, milling, sieve, package and storage events | Can the trend be linked to a controlled event? |
Share trend expectations with the supplier before a new lot is released. A buyer and supplier can then investigate meaningful movement instead of arguing over a single number generated under different conditions.
Set a Urolithin A particle size specification without overfitting
Therefore, an incoming specification should be tight enough to control the process and broad enough to reflect normal, capable production. If the range is narrower than the method’s repeatability or the process’s normal variation, it will create administrative failures rather than useful control.
To set the range, use development data, pilot runs, historical lots, equipment limits and measurement capability. State whether the limit applies to D-values, sieve fractions, oversize, fines or a combination. Include the method version and sampling rule.
Specification design questions
- Which physical behaviour is the limit intended to control?
- Is the output mass-, volume- or number-based?
- Does the limit apply before or after deagglomeration?
- How many samples and containers support the result?
- How strong is the method repeatability near the proposed limit?
- Which action follows an out-of-range result?
- Will the same method be available at supplier and buyer laboratories?
The technical resources area can support a specification request, but the final limits should be agreed with the teams who operate the equipment and release the material.
Transfer Urolithin A particle size methods between laboratories
However, particle-size methods can disagree because of different dispersion energy, optical models, sieve loading, conditioning, instrument alignment or data-processing settings. A transfer record should compare the method inputs before comparing the reported D-values.
Where possible, use a retained lot or shared sample. Record the sample split, storage, timing, instrument, settings, software version and replicate design. If the laboratories use different techniques, define which attribute each technique is intended to control instead of forcing numerical equivalence.
Transfer record
- Identify the common lot and sample preparation.
- Compare instrument type, method version and calculation basis.
- Align conditioning, dispersion and measurement endpoint.
- Run replicate preparations at each laboratory.
- Compare distribution plots and critical tail fractions.
- Set an acceptance rule and document any method-specific bias.
Do not write “method equivalent” when one laboratory measures dry agglomerates and another measures dispersed primary particles. Describe the difference and control the attribute that actually matters.
Link particle properties to packaging and storage
During storage, particle behaviour can change because of moisture exchange, temperature cycling, vibration, consolidation and repeated opening. Packaging and warehouse records therefore belong in a physical-property investigation.
If a buyer changes the container or pack size, compare the headspace, liner, closure, fill depth and expected opening frequency. A retained sample stored in a sealed laboratory bottle may not represent a production pack opened repeatedly during manufacturing.
Storage-review questions
- Was the particle test performed on material before or after shipping?
- Were temperature and humidity conditions recorded?
- Was the package opened, resealed or repacked before testing?
- Did vibration or consolidation alter bulk density or agglomeration?
- Does the storage instruction match the container actually used?
For a lot-specific quality discussion, include package configuration and storage history in the quality-file request form.
Use particle data during process development
In practice, physical-property data are most useful when they guide a controlled trial. Define the amount of material, equipment, blending order, feed rate, screen, mixing time and observations. Then record which particle attribute was associated with the process result.
For a low-inclusion blend, density and segregation may matter more than the median particle size. By contrast, a direct-compression project may depend more on flow and compressibility than on a narrow D50. For a reconstitution powder, wetting and agglomerate behaviour may instead be the critical observations.
Development-trial record
| Trial field | Record | Reason |
|---|---|---|
| Material | Lot, particle data, moisture and package | Connects behaviour to a defined sample |
| Equipment | Feeder, blender, screen or mixer settings | Allows another team to reproduce the trial |
| Process | Order, time, speed, feed rate and environment | Separates material effects from process effects |
| Observation | Flow, segregation, wetting, dust or residue | Links the physical result to a practical issue |
| Decision | Accepted range, adjustment or additional study | Turns data into a controlled next step |
Keep development observations separate from a release specification. A useful trial result can inform the target without becoming an unsupported universal claim about every lot.
Investigate an unexpected Urolithin A particle size result
When a result moves outside its normal range, first confirm sample identity, container, method version, conditioning, instrument status and data processing. Then compare moisture, density, morphology and process history before deciding whether the powder changed or the measurement changed.
Then, retesting should follow an approved plan. Do not select a new portion simply because it gives a more convenient value. Preserve the original result, sample and calculations so the investigation remains reconstructable.
Investigation sequence
- Verify lot, container, label and chain-of-custody records.
- Check sample preparation, conditioning and dispersion or sieve settings.
- Review instrument suitability, alignment, sieve condition or software output.
- Compare moisture, density, morphology and recent process events.
- Define any resample or retest under an authorised protocol.
- Document root cause, lot disposition and supplier follow-up.
Connect the investigation to the supplier’s change-control and COA records when a process, package or method change may explain the shift.
Create a buyer-side powder-property scorecard
In addition, a scorecard keeps the review focused on evidence that supports a decision. It also helps procurement compare supplier data without treating a polished graph as proof of process compatibility.
Particle-data scorecard
| Area | Strong evidence | Conditional evidence | Gap |
|---|---|---|---|
| Purpose | Process decision and critical attribute are defined | Application is described but equipment is pending | Generic “fine powder” claim |
| Sampling | Container, location, portion and composite rule recorded | Lot is known but location detail is limited | Unidentified scoop sample |
| Method | Technique, preparation, settings and basis are controlled | Method summary available on request | Only a micron number |
| Distribution | D-values, tails and spread reported | D50 only with a defined use | No distribution context |
| Related properties | Moisture, density and flow linked to the operation | One supporting property is pending | Flow claim without a test |
| Comparability | Same lot and aligned methods across laboratories | Different methods with a defined attribute | Numbers compared without method context |
Finally, use the scorecard to request the next useful record or trial. It does not replace a process qualification, validated laboratory method, incoming release procedure or application study.
Frequently asked questions about Urolithin A particle size
Is D50 enough for an incoming specification?
Usually not. D50 describes the centre of the reported distribution but not the fine or coarse tails. If those tails affect handling, request D10, D90, a spread metric or a defined sieve fraction as well.
Can two suppliers report the same particle size using different methods?
They can report the same number, but the numbers may not be comparable. Check sample preparation, dispersion energy, measurement basis, instrument settings and data processing before using the values in a supplier comparison.
Does smaller particle size always improve dispersion?
No. Smaller particles may increase surface area and cohesion, while agglomerates, wetting and the liquid matrix also influence dispersion. Confirm the behaviour in the intended process rather than inferring it from D50.
Why can a supplier’s PSD differ from the buyer’s result?
Sampling, moisture, conditioning, deagglomeration, instrument model, optical assumptions and calculation basis can all contribute. Use a shared lot and a method-comparison record before concluding that the material changed.
Should particle size be tested on every lot?
The frequency depends on process capability, lot history, change risk and the buyer’s specification. A risk-based plan may use every-lot testing, periodic verification or enhanced testing after a process or package change.
How should a buyer specify agglomerates?
Define whether the test measures as-received clusters or particles after a controlled dispersion step. Add a measurable oversize fraction, image rule or sieve limit when agglomerates affect the equipment.
Can a particle-size result prove a lot will run on a customer’s machine?
No. It can support screening and comparison, but machine performance also depends on feeder geometry, speed, humidity, blend composition and operating settings. A small controlled trial is needed when equipment response is important.
Turn powder data into a usable specification
A defensible Urolithin A particle-size program connects a representative sample to a defined method, a meaningful distribution, related physical properties and a real process decision. The goal is not to collect the smallest number of microns; it is to make powder behaviour predictable enough for the buyer’s operation.
Before approving a supplier range, request the sampling plan, method conditions, D-values, moisture and density context, relevant flow evidence and the first-lot comparison rule. For a technical sourcing discussion, send the application, equipment, package and required physical-property fields through the Urolithin A procurement brief.
Scope note: This article is a B2B ingredient-quality framework. It does not replace the buyer’s validated methods, process qualification, quality agreement, regulatory assessment or finished-product release system.